Albert Einstein once said, 'Out of clutter, find simplicity.'
K-means clustering does exactly that—turning data chaos into meaningful insights.
K-means clustering is as simple as organizing your closet: shirts, pants, and shoes all find their natural places—automatically,
– but this algorithm is as impactful as planning a city’s public transport routes.
Let’s dive deep into K-Means clustering, but before that here are the key takeaways.
Key Takeaways :
What is K-Means Clustering?
- K-Means Clustering is an unsupervised learning method that organizes data into distinct groups (clusters) based on similarities, much like grouping party guests by interests.
How Does it Work?
- Define the number of clusters (k).
- Randomly place centroids as starting points for groups.
- Assign data points to the nearest centroid.
- Recalculate centroid positions and repeat until clusters stabilize.
Practical Python Example:
- Use libraries like pandas, numpy, and sklearn to cluster data such as movie ratings into meaningful groups, with optional visualization using matplotlib.
Applications of K-Means:
- Market Segmentation: Understand customer behavior and tailor strategies (e.g., sports enthusiasts vs. fashionistas).
- Image Segmentation: Compress images by simplifying colors.
- Anomaly Detection: Identify outliers like fraudulent transactions.
Choosing the Right Number of Clusters (k):
- Elbow Method: Look for the "elbow" in a cost vs. k plot where adding clusters yields diminishing returns.
- Silhouette Method: Evaluate cluster cohesion and separation for optimal group formation.
Advantages of K-Means:
- Simple and intuitive to use.
- Scales well with large datasets.
- Versatile applications across industries.
Disadvantages of K-Means:
- Determining the ideal k can be challenging.
- Works best with numerical data.
- Sensitive to initial centroid placement, which may lead to suboptimal results.
FAQs:
- Supervised or Unsupervised? K-Means is unsupervised, automatically grouping data without predefined labels.
- Predictive Use? While not directly predictive, it helps organize data to improve forecasting accuracy.
- K in K-Means? Refers to the number of clusters you want to form.
K-Means vs. KNN: K-Means groups data (clustering), whereas KNN predicts outcomes (classification or regression).
What is K-means Clustering?
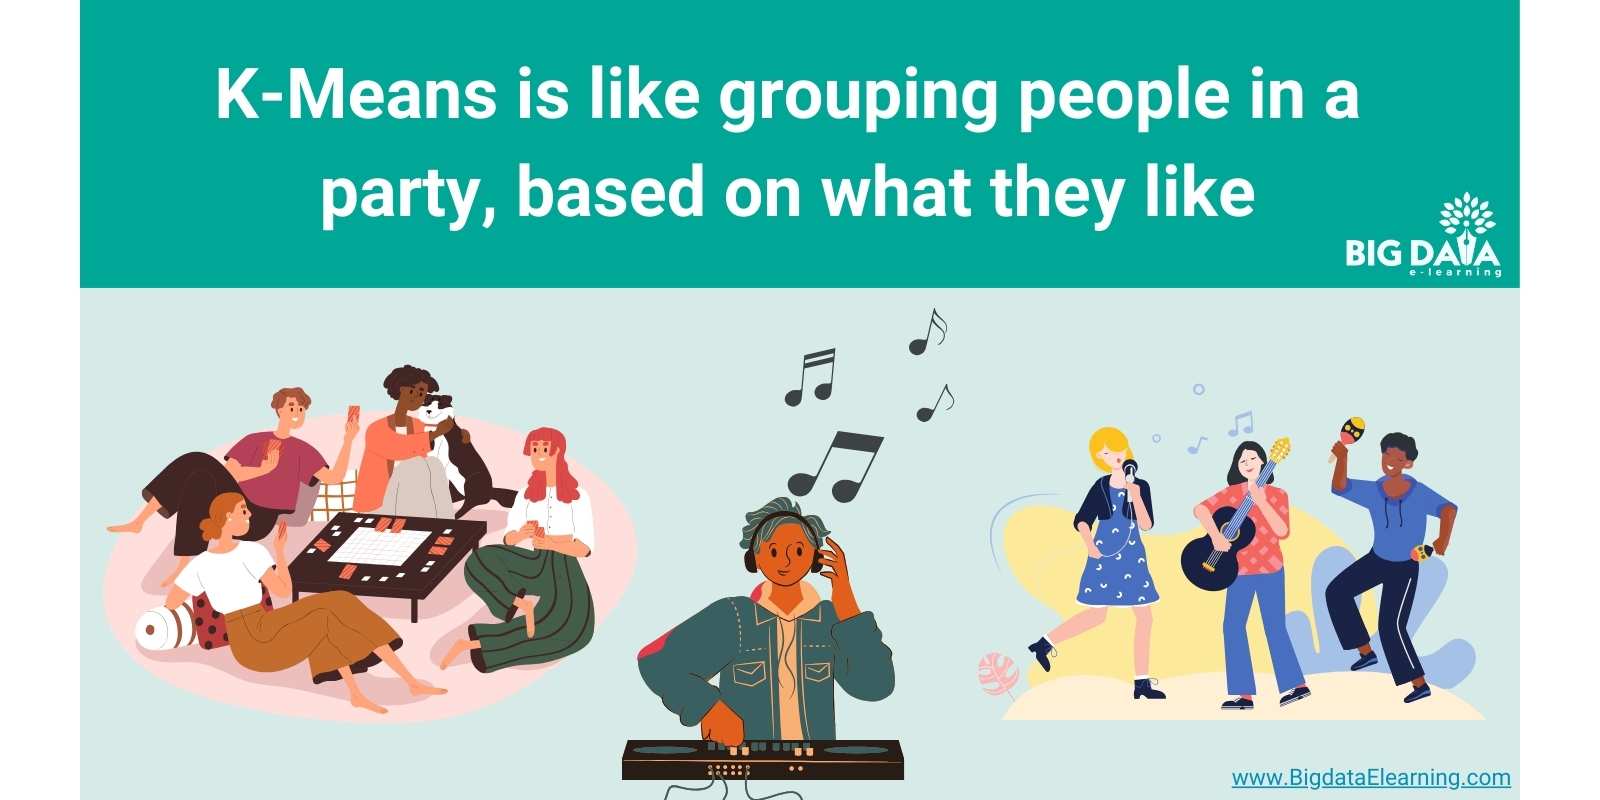
Imagine you're throwing a massive party, and you're trying to figure out where everyone should hang out. You've got the music buffs, the board game geeks, and the chatty folks.
But here’s the deal: grouping them isn’t as hard as you think.
K-means clustering in machine learning is like an ultimate party planner.
It’s not just guessing—it’s a smart way to group people together based on their vibes.
But wait—there’s one thing you need to know.
You can set up the perfect groups without knowing everyone personally.
Cool, right?
How does k-means clustering work?
Alright, let's break down how K-means clustering works using the fun party analogy:
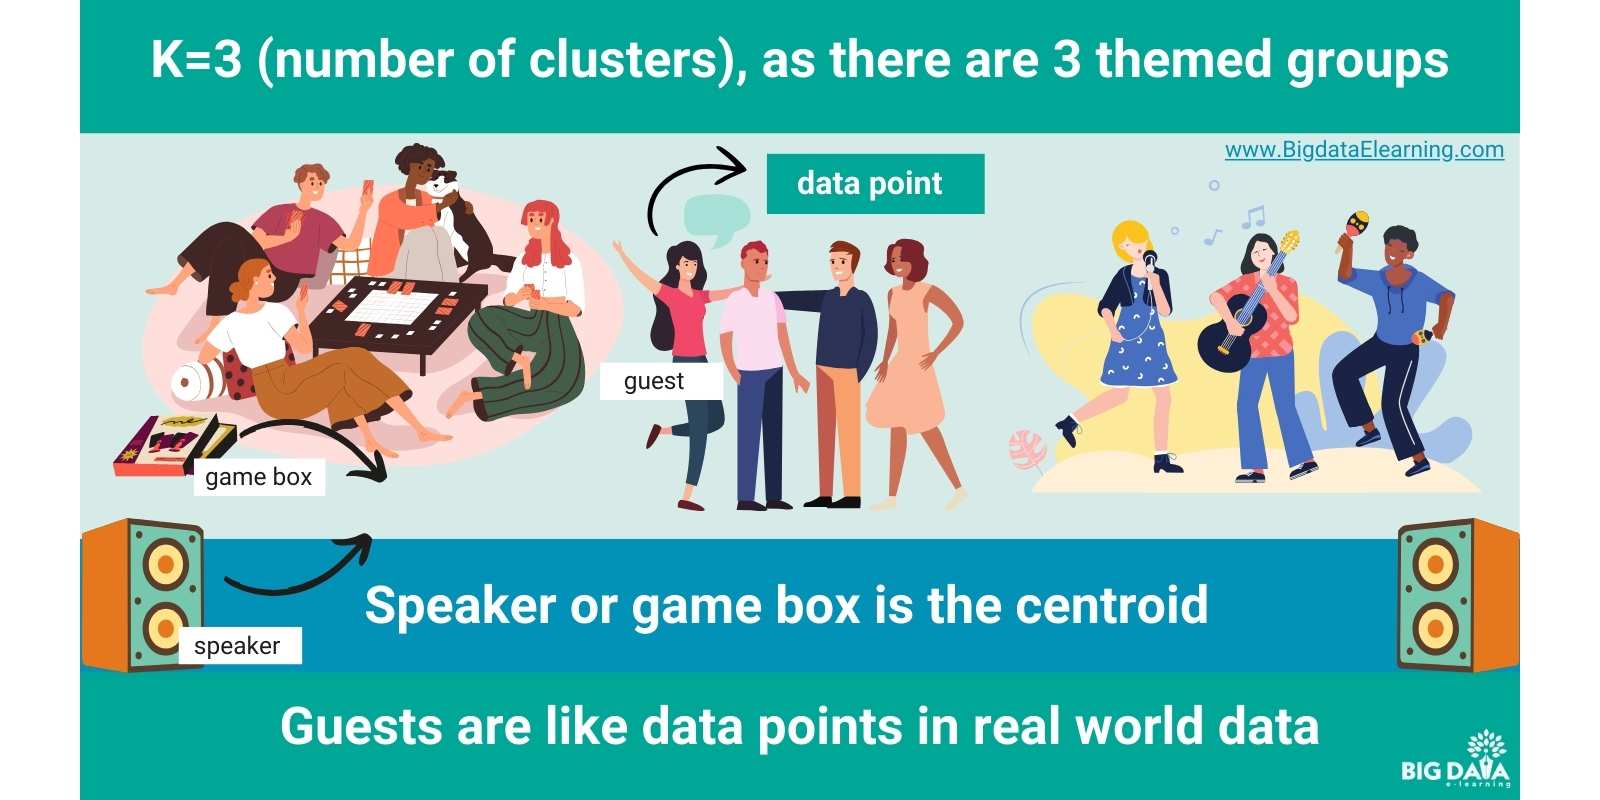
First, you decide how many themed corners to set up at your party.
Two?
Three?
Maybe even more.
For example:
- Two corners could cater to music lovers and gamers.
- Three could add a third: chit-chat enthusiasts.
But here’s where it gets interesting—you don’t stop there.
Imagine your guests spreading out across these themes.
Each person naturally gravitates to where they feel they belong.
For example,
- Music lovers gather near the speakers.
- Gamers huddle near the game box.
Here’s the secret sauce:
In K-means clustering,
- these guests represent the data points,
- and the themes are the clusters.
So, how do we make it work?
First, you set the K value—that’s the number of clusters - think of them as the number of themed corners.
Next, you randomly pick centroids—think of them as the “party promoters.” These are like your speakers or game box.
Now, here’s where things get fun.
The guests in the party are the data points in the real world data. For example the data points could be like “movie ratings” or “music preferences” of users. Guests (or data points) start gravitating toward the centroids based on how close they are.
Still with me? Great! Because there’s more.
But what happens if someone feels out of place?
What if a guest (or data point) doesn’t quite fit?
The group leaders adjust their positions to be more central within their groups based on who's joined. It's like repositioning the DJ booth to keep the party going strong.
And we repeat this shuffle until the groups settle, meaning the centers stop moving much.
Boom!
Your data is now neatly grouped into clusters based on their similarities, just like a well-organized party!
Hands-On K-Means Example in Python
Let’s uncover the k-means algorithm with an example in machine learning.
Understanding the Libraries
First, we'll use:
- pandas to load and manipulate data.
- numpy for numerical operations.
- matplotlib.pyplot for visualization
- sklearn.cluster for the K means algorithm formula.
Sample Data: Let's Look at Movie Ratings
Imagine you have movie ratings from different users, each rating movies on a scale of 1 to 5.
We want to group users with similar movie tastes using K-means clustering.
Here's a sample dataset
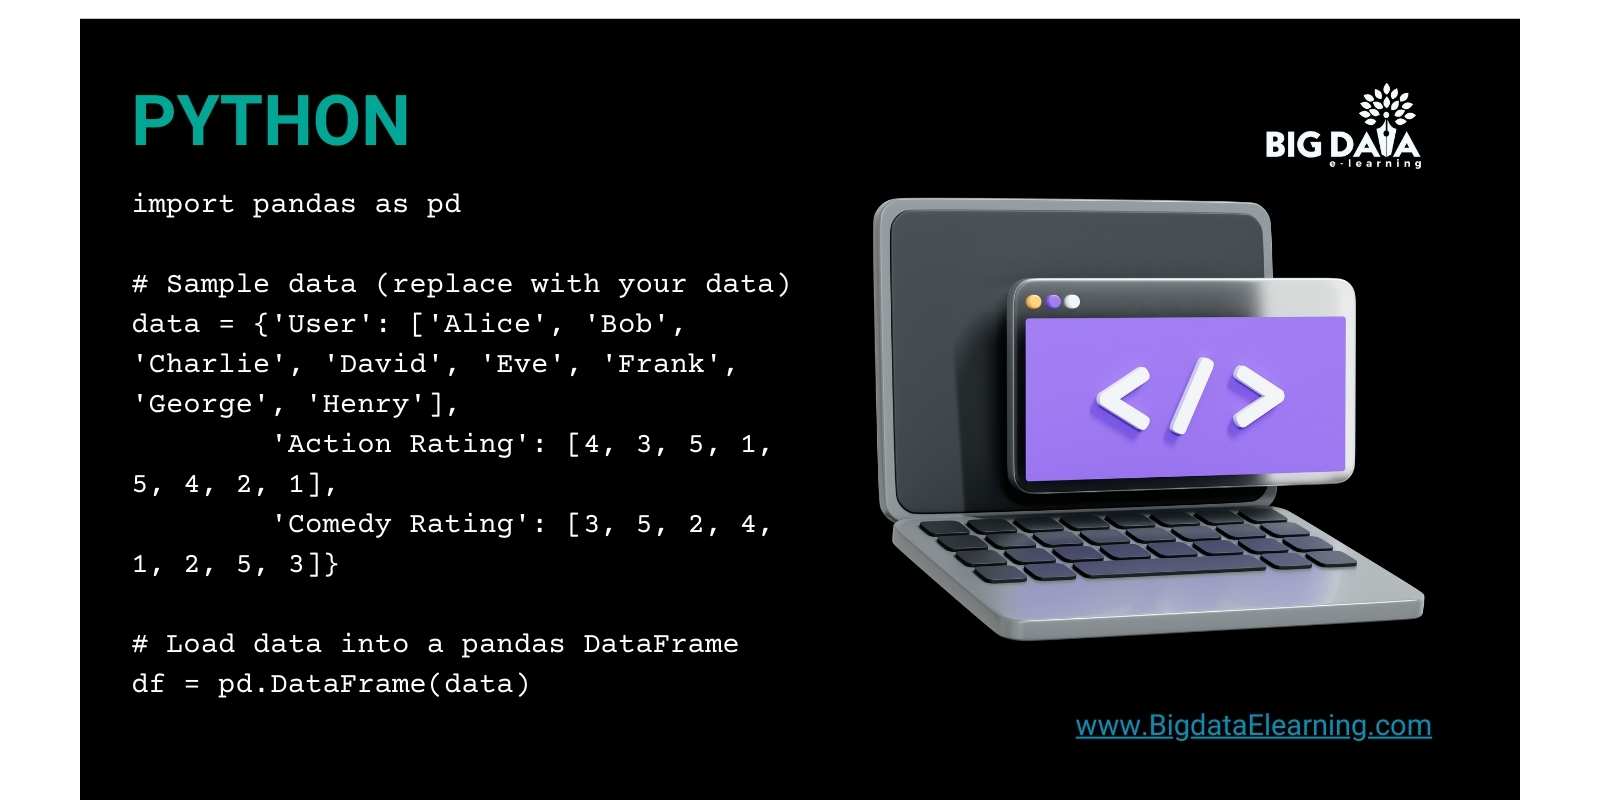
Preparing the Data
K-means works best with numbers, so our ratings are perfect for it!
Choosing the Number of Clusters (k)
Let's try clustering users into 2 groups:
Python
# Number of clusters (k)
k = 2
Running K-Means Clustering
Now, let's use scikit-learn's KMeans function:
Python
from sklearn.cluster import KMeans
# Create the KMeans object
kmeans = KMeans(n_clusters=k, random_state=0) # Set random_state for reproducibility
# Fit the model to the data (training)
kmeans.fit(df[['Action Rating', 'Comedy Rating']]) # Use only the rating columns
# Get cluster labels for each data point
cluster_labels = kmeans.labels_
Understanding the Results
- cluster_labels: This is a list that shows which cluster each user belongs to (0 or 1 in our case).
Visualizing the Clusters
You can plot the data points with assigned colors for each cluster:
Python
import matplotlib.pyplot as plt
# Get the cluster centroids
centroids = kmeans.cluster_centers_
# Plot data points with assigned cluster colors
plt.scatter(df['Action Rating'], df['Comedy Rating'], c=cluster_labels)
plt.scatter(centroids[:, 0], centroids[:, 1], marker='x', s=150, c='red', label='Centroids')
plt.xlabel('Action Rating')
plt.ylabel('Comedy Rating')
plt.title('K-Means Clustering (2 Clusters)')
plt.legend()
plt.show()
Interpreting the Clusters
Now, let’s peek behind the curtain.
By looking at the plot, you can see how users are grouped based on their movie ratings.
Analyze these clusters carefully to spot common patterns.
For instance, some groups might consistently rate action movies highly, while others favor rom-coms.
Remember, this is just a basic example. Real-world data might need more preprocessing and exploration.
Practical Use Cases of K-means
Here’s where K-means shines in the real world. Let’s dive into a few scenarios:
Market Segmentation
So, picture this:
You’ve got heaps of customer purchase history data.
K-means steps in like a hero, clustering your customers based on shopping habits.
For example:
- One cluster could be "sports enthusiasts" buying athletic wear.
- Another might be "fashionistas" splurging on trendy clothes.
It’s like Walmart using this method to tailor its marketing strategies for different customer personas.

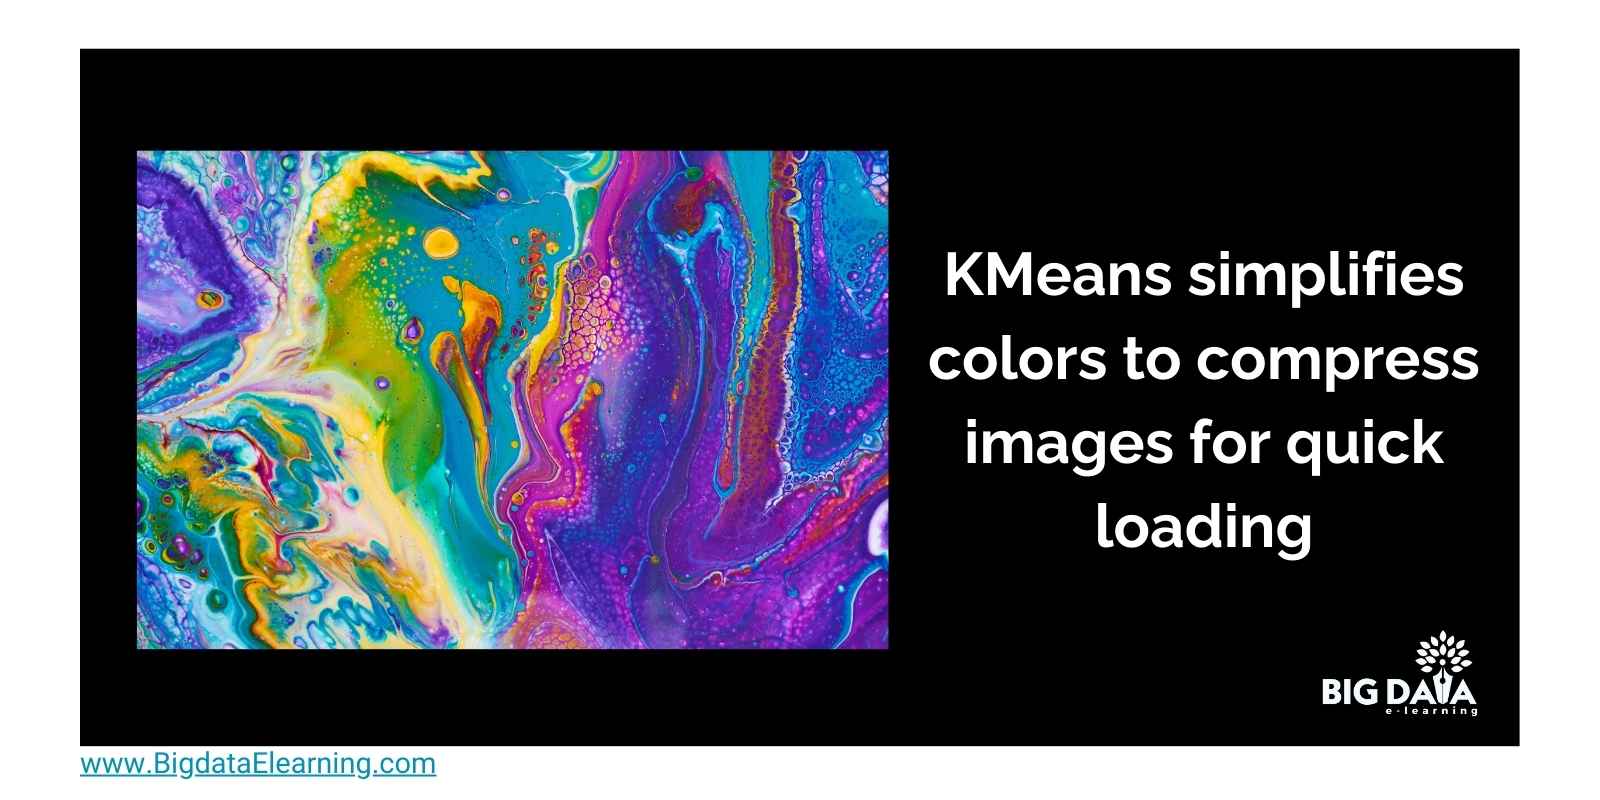
Image Segmentation
Now, onto something visual.
K-means simplifies image colors, compressing them for quicker loading.
Think of it as reducing a painting to its most essential hues while retaining its beauty.
Anomaly Detection
Now, onto something a bit more serious.
K-means isn't just about fun and games; it's a data detective too.
It can sniff out anomalies in data, like those pesky fraudulent credit card transactions that deviate from the norm.
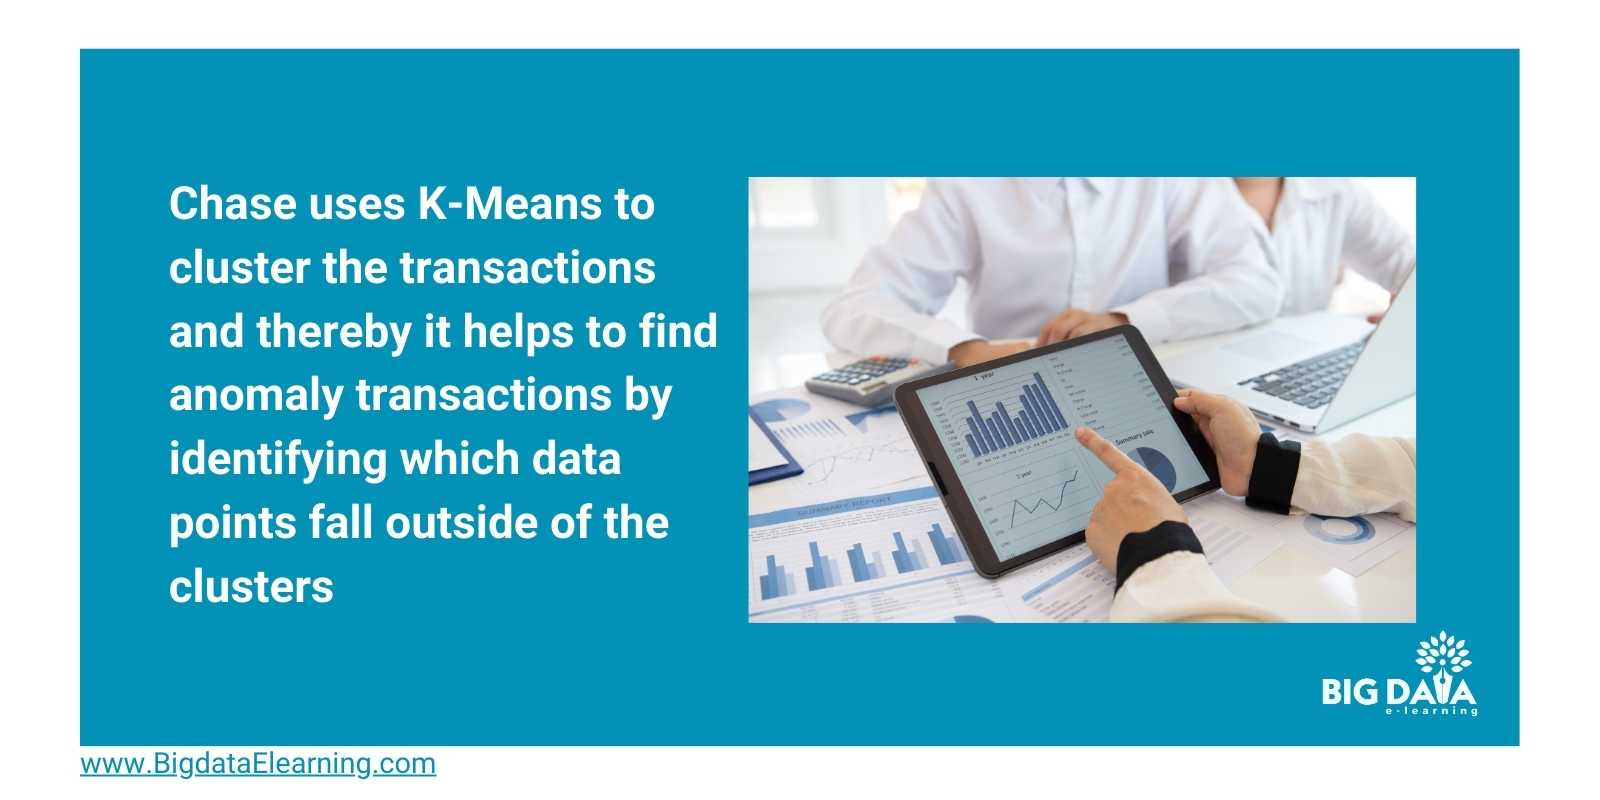
It's like having a vigilant security guard who spots troublemakers in a crowded room.
How to choose the value of "K" in K-means Clustering?
Let’s break it down with two popular methods:
First let’s dive into the elbow method.
The Elbow Method
You’re back to planning your party.
Think of “cost” as your party bill—the lower, the better.
Here’s how it works:
- Try different “themed corners” (k values) and calculate the cost.
- Let’s say as you add more “themed corners”, the cost per guest goes down.
- However after increasing it beyond certain number, the cost doesn’t go down that much
This is the same way the Elbow Method works. Below are the steps involved.
1) Plot these costs on a graph:
- The X-axis shows the “number of themed corners” (k).
- The Y-axis shows cost. In actual KMeans , the cost is nothing but "within-cluster sum of squares" (WCSS) which measures how closely the data points in a group are clustered together.
2) As K increases, the WCSS decreases.
3) Look for the “elbow”—that point where the WCSS stops dropping dramatically. As you increase k, the cost (WCSS) usually goes down. But there's a point where adding more people doesn't reduce the cost much—that's the "elbow" in the graph.
Still with me? Great!
4) The best k is where the cost stops decreasing. Adding more groups here doesn't improve how well the data fits within the clusters. Choose k at this elbow point. It’s where your clusters fit best without overcomplicating things.
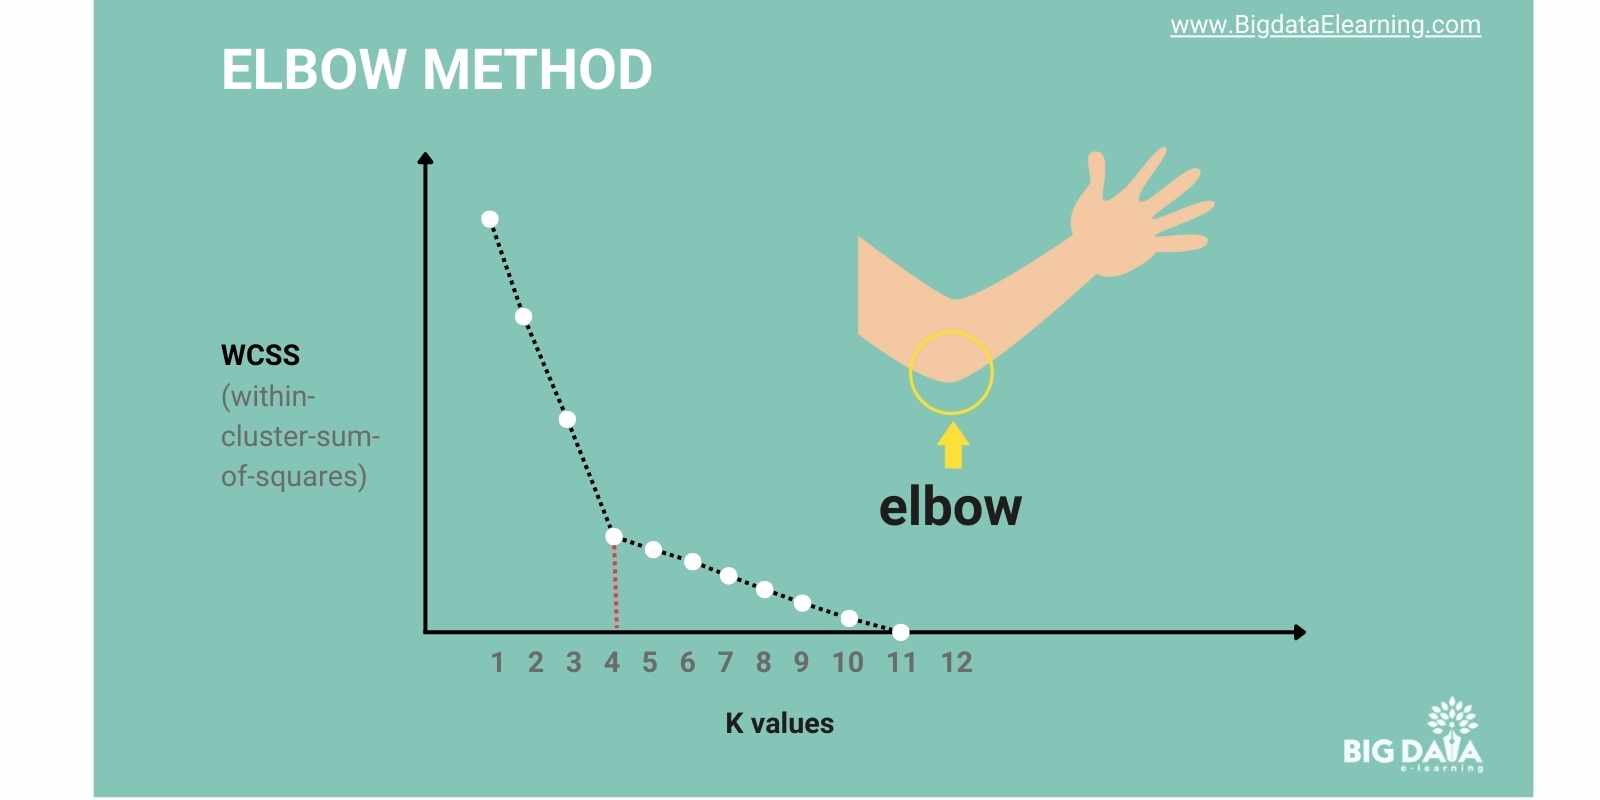
So, next time you're wrangling data, try the Elbow Method to find that perfect k for your K-means clustering!
Silhouette Method
Picture this:
You’re organizing practice groups for a sports team.
You want balanced teams where players with similar skills stick together.
You want to make sure each player is highly cohesive within their own team, but well separated from the other team’s strategies, right?
Enter the Silhouette Method, your game plan for forming cohesive, well-separated groups.
Here’s how it works:
- Cohesion (a): How close a point is to its own cluster. A high score means they blend well, like teammates with matching skills.
- Separation (b): How far a point is from other clusters. A high score means distinct, well-separated groups.
To make things easy, the Silhouette Score is used. This combines the cohesion and separation and gives a score that ranges between -1 and 1.
Silhouette Score: What does it mean?
- Close to 1: Indicates that the data points are well-clustered, meaning they are closer to their assigned cluster center than to any other cluster center.
- Close to 0: Suggests that the data points are on the border of two clusters, meaning clustering is not distinct.
- Negative scores: Indicate that points are likely assigned to the wrong cluster because they are closer to another cluster center than their own.
Thus, if your clustering achieves a score near 1, it means your clusters are well-formed and distinct, making the algorithm's performance highly reliable.

Advantages & Disadvantages of K-means
Advantages
- Simplicity: K-means is easy to grasp and apply, even for those new to machine learning. Its analogy to organizing a party makes it intuitive.
- Scalability: It efficiently handles large datasets, much like managing a big party with many guests.
- Versatility: From customer segmentation to image compression, K-means finds applications in various fields, showcasing its adaptability.
Disadvantages
- Choosing k: Selecting the right number of clusters (k) is crucial. Too few groups may split similar data points, while too many can lead to indistinct clusters.
- Numeric Data Dependency: K-means is most effective with numerical data and may not suit text data categorization directly.
- Local Minima: If the initial centroids are poorly chosen, K-means may converge to suboptimal clusters, akin to being stuck in a corner at a party when everyone else is settled.
Now that we have seen the pros and cons, let’s take a quick peek into some of the commonly asked questions on K-Means.
FAQs
Is K-means Clustering supervised or unsupervised?
K-means clustering belongs to the realm of unsupervised learning.
K means algorithm unsupervised learning autonomously discerns patterns or clusters within data, without relying on predefined labels or classifications.
This makes it adept at organizing unlabeled data into meaningful groups based on similarities.
Is K-means used for Prediction?
While K-means clustering doesn't directly predict outcomes, it helps you understand your data better, which can improve your predictions.
By organizing your data into groups based on similarities, K-means sets the foundation for more accurate predictions in your projects.
What is K in KMeans Clustering?
In K-means clustering, K stands for the number of clusters you want the algorithm to create from your data.
It's a critical factor because it determines how many distinct groups your data will be divided into.
For instance, if you set K to 2, the k-means algorithm in machine learning will split your data into two separate clusters based on similarities.
Choosing the right K is key because it ensures that your clusters accurately represent the underlying structure of your data.
Too few clusters might oversimplify things, while too many can lead to unnecessary fragmentation.
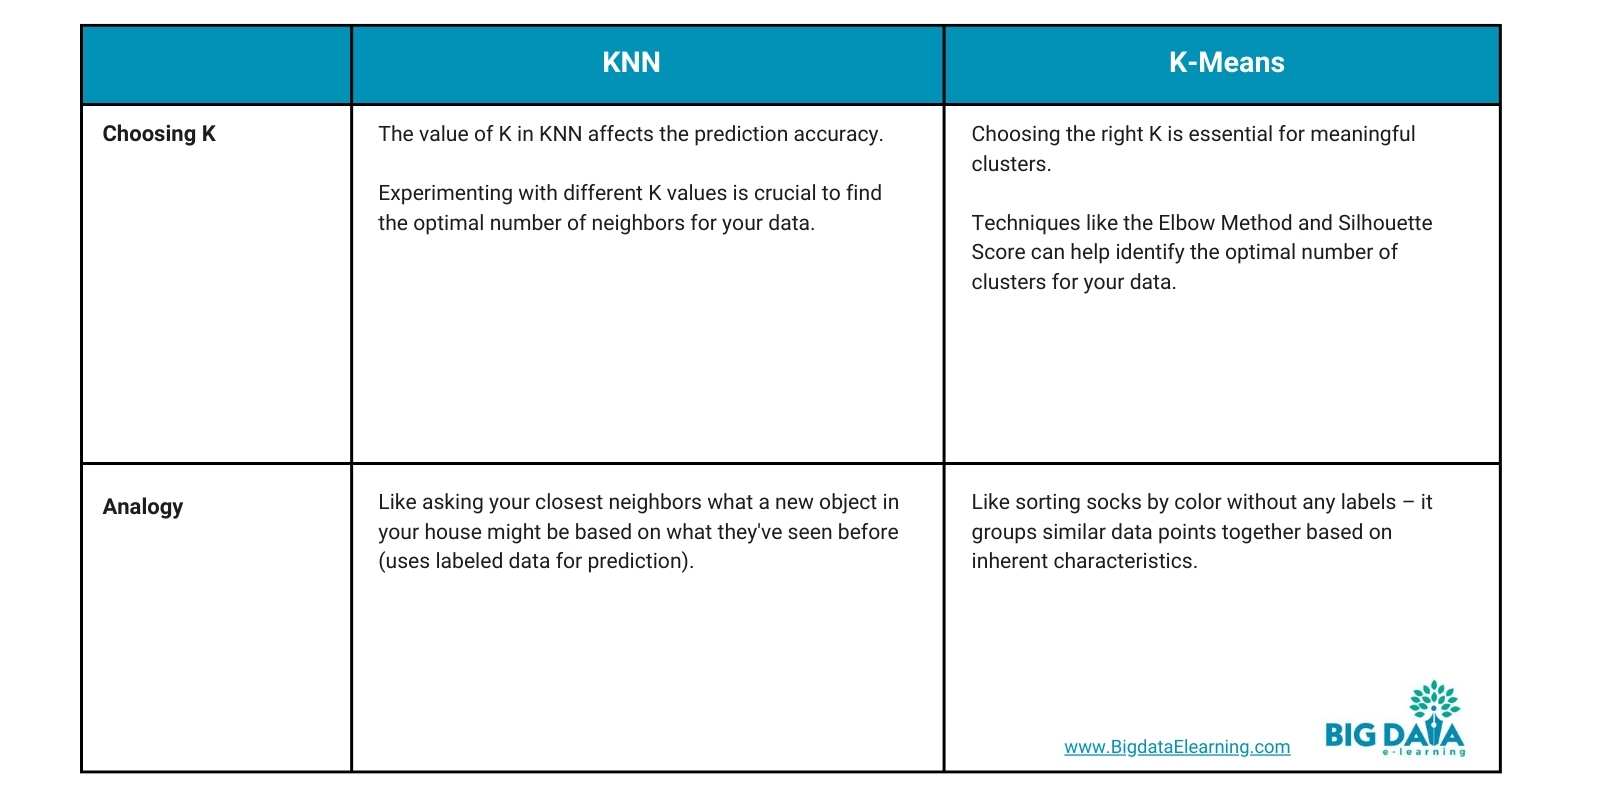
What is the difference between KNN and KMeans Clustering?
KNN (K-Nearest Neighbors) and K-Means Clustering are both fundamental machine learning algorithms, but they serve different purposes and operate under distinct principles.
Here's a breakdown of their key differences:

At what point do you stop with a clustering problem?
- Elbow Method: Look for the "elbow" point on a cost function plot to find where adding more clusters doesn't significantly reduce the cost.
- Silhouette Score Analysis: Identify the K value with the highest average score.
Conclusion
In this guide, we've delved into the world of K-means clustering, breaking down complex concepts into simple, relatable terms.
Here's a quick recap of what we've covered:
- Understanding K-means Clustering: Think of it like sorting people into groups at a party based on their interests without knowing them personally.
- How K-means Works: We've explained it step by step, from deciding how many groups to make to shuffling people around until they settle into their groups.
- Practical Example in Python: We showed how to do it with movie ratings data using Python.
- Real-world Applications: From understanding customers to recommending music, K-means has lots of cool uses!
- Choosing the Right K: We talked about picking the best number of groups for your data using tricks like the Elbow Method.
- Evaluation Metrics: We looked at ways to check if our clusters are good, like the elbow method and Silhouette Score.
- Advantages & Disadvantages: K-means is easy and versatile, but you gotta watch out for picking the right number of groups.
- FAQs: We answered common questions about how K-means works and when to stop clustering.
So, with these tools in your belt, you can tackle data like a pro and find all the hidden patterns hiding in there!
Stay connected with weekly strategy emails!
Join our mailing list & be the first to receive blogs like this to your inbox & much more.
Don't worry, your information will not be shared.


